Tableau
Sales Dashboard
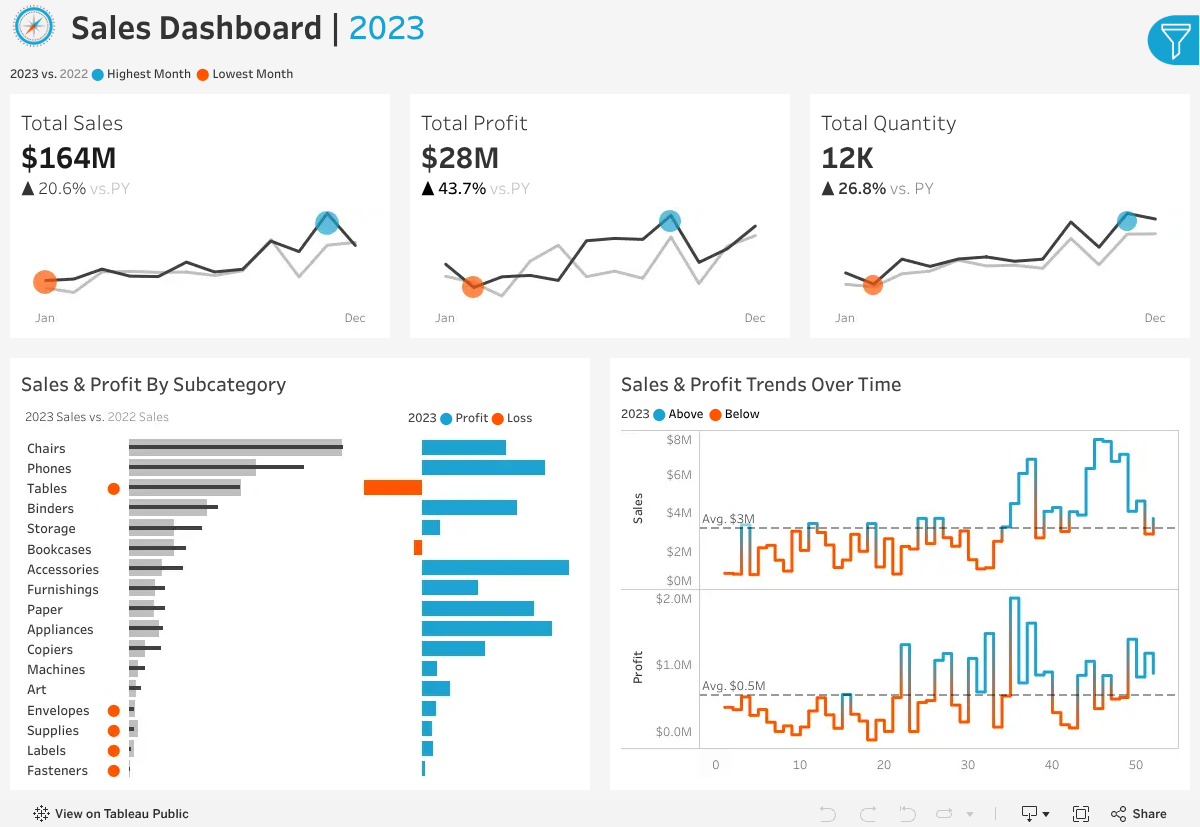
An interactive Tableau dashboard covering sales performance across KPIs, trends, and segment comparisons, built so people could answer their own questions instead of asking me for another export.
The problem
Sales questions were being answered one export at a time. Someone wanted last quarter by region, someone else wanted the same cut by category, and each request turned into a fresh spreadsheet that nobody could reproduce a week later.
The underlying data was fine. The access to it was the bottleneck. Every answer depended on a person being available to pull it, which meant questions that were not urgent enough to ask simply went unasked.
What I built
One Tableau dashboard designed around the questions people actually kept asking, rather than around the shape of the tables underneath.
The top of the view answers the first question anyone has, which is whether the numbers are up or down and by how much. Underneath that sit the drivers: performance by segment, by category, and over time. Filters let someone narrow to the slice they own without touching anything else.
How it works
Before any of it could be charted, the source data needed a consistent grain. I standardized the transaction level, resolved the date fields down to one trustworthy order date, and rebuilt the category labels so the same product did not appear under three different spellings.
From there the measures are calculated once, in the workbook, with names people recognize. That is the part that keeps two people from opening the same dashboard and walking away with different numbers.
The dashboard, live
This is the real workbook, not a screenshot. Filter it, hover the marks, and drill into whichever segment you care about.

Here is a preview of the workbook. The interactive version needs more room than a phone screen gives it, so open it full size when you have a moment at a desktop.
 Open the live dashboard
What it produced
The dashboard replaced the export-on-request loop. People who needed a number started pulling it themselves, which cut the turnaround on routine questions from a day or more to the length of time it takes to load a page.
The more useful outcome was quieter: because the definitions live in one place, the conversation moved off whose number was right and onto what to do about it.
Let's work together
I'm open to data analyst roles and freelance analytics work. Whether you have a question or just want to say hi, my inbox is always open.
Say hello